Learn how scientists measure earthquakes with seismic waves, seismographs, magnitude, intensity, faults, and clear kid-friendly examples. Chitran International Online Art Classes, LLC created this learning guide to help families connect clear science ideas with visual thinking and confident questions.
Scientists measure motion, not just feelings
People may describe an earthquake as “huge” or “small,” but scientists need measurements. They record ground motion with instruments, compare data from several locations, and use mathematical models. This makes it possible to describe an event even in places where few people felt it.
The seismograph
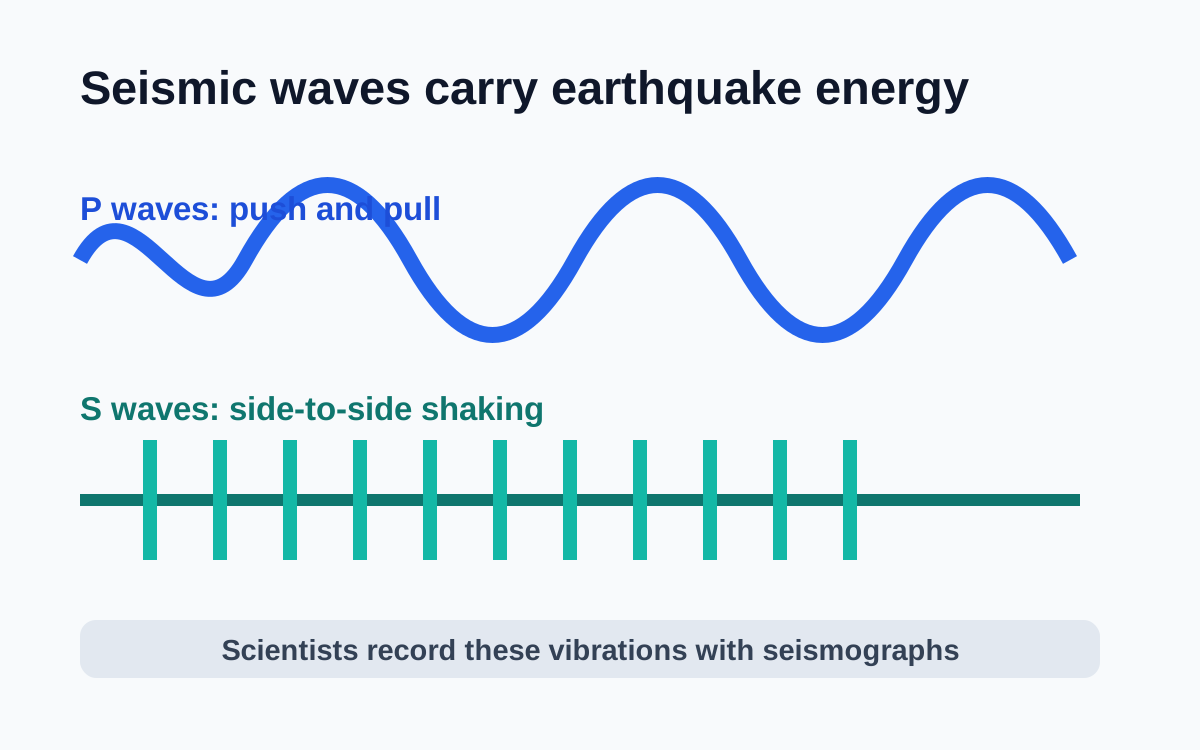
A seismograph records movement of the ground over time. The record is called a seismogram. If the ground shakes, the instrument creates a wavy line that helps scientists see when waves arrived and how strong the motion was. Modern stations can send information quickly to monitoring networks.
P waves and S waves
P waves are usually the fastest seismic waves, so they often arrive first. S waves generally arrive later and move rock differently. The time gap between their arrivals helps scientists estimate the distance from a station to the earthquake. Data from multiple stations helps locate the focus.
From stations to a location
Imagine three friends hearing a drumbeat at slightly different times. Each person can estimate how far away the drum is, but one estimate makes a wide circle of possibilities. Several estimates narrow the answer. Earthquake scientists use a more precise version of this idea with wave arrival times.
Magnitude tells source size
Magnitude is a number that represents the size of an earthquake at its source. It is not a simple “one point equals one more shake” scale. Because the scale is logarithmic, each whole-number step represents a large increase in wave amplitude. Scientists calculate magnitude from carefully corrected instrument data.
Intensity tells what happened in a place
Intensity describes observed effects at a particular location: how shaking felt, what objects moved, and how buildings responded. A town close to an event on soft ground may experience stronger shaking than a town farther away on solid rock. This is why maps of intensity show patterns, not just one number.
Faults, focus, and epicenter
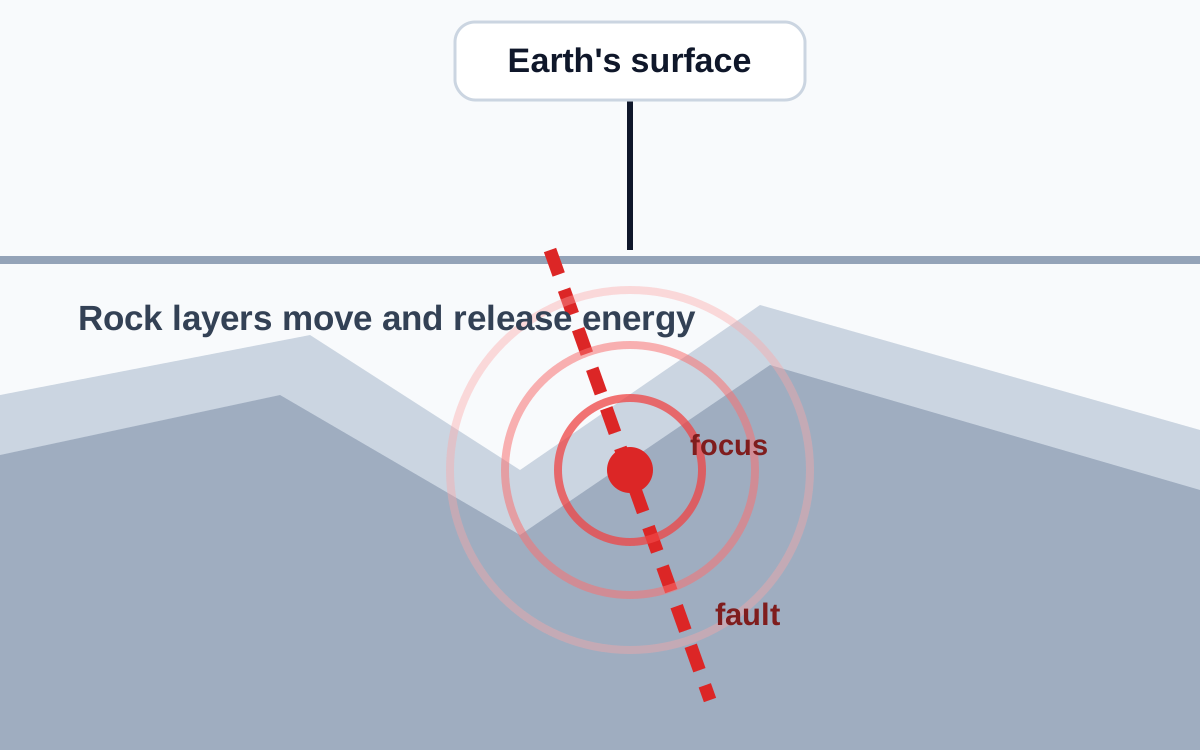
A fault is a rock fracture where movement can occur. The focus is where the rupture begins underground; the epicenter is the surface point above it. These terms are tools for communication. They help scientists, journalists, and communities describe an event accurately.
Sketchbook science challenge
Draw a horizontal timeline for a seismogram. Mark first-arriving P waves, later S waves, and the strongest section of shaking. Then make a simple key explaining your marks. The goal is not to copy a real instrument record perfectly; it is to show how data becomes a visual story.